
On The Science of Seismic Events
Princeton University investigates, researches, and informs the public about earthquakes worldwide. Princeton University works in collaboration with the scientific community to provide information that enhances our knowledge and understanding of earthquakes.
What do these movies show?
These movies illustrate the up-and-down velocity of the Earth's surface. Strong blue waves indicate the surface is moving rapidly downward. Strong red waves indicate rapid upward motion. When the waves pass through soft soils (sediments) they slow down and amplify. Waves speed up when they pass through hard rock. The color of the waves oscillates between red and blue indicating alternating up and down motion.
These movies were created by the following procedure (Tromp et al. 2010):
Event
Trigger
Every time an earthquake occurs in the world, thousands of seismograms are recorded at hundreds of seismographic stations. From these seismograms, information about the earthquake can be quickly inferred, including its epicenter, depth, as well as its intensity. These so-called Central Moment-Tensor (CMT) solutions are routinely determined by Lamont-Doherty www.globalcmt.org.
Simulation
Setup
Using several hundred compute cores of a large parallel computer, we subsequently simulate the seismic waves generated by the earthquake in a three-dimensional (3-D) global seismic wave speed model using the source parameters determined by the CMT program. At periods of about 60 seconds and longer, simulated wave motion closely resembles data recorded at seismographic stations.
+ zoom in
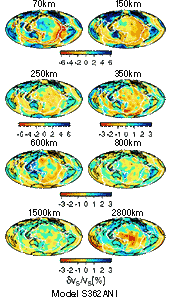
Map views of 3D mantle model S362ANI [Kustowski et al., 2008] at depths of 70km, 150 km, 250 km, 350 km, 600 km, 800 km, 1500 km, and 2800 km. The range in shear-wave speed perturbations is indicated in parentheses above each map. White lines represent plate boundaries and black lines continents. The shear-wave speed (Vs) in regions colored blue (red) is higher (lower) than in PREM (Figure below). Shearwave speed variations in the upper 200 km of the mantle range from 8% to 8%. Note that in the shallow mantle (i.e., at 200 km depth), high shear-wave speeds are associated with old (cold) cratons, whereas low shear-wave speeds correspond to mid-oceanic ridges, where hot material wells up. In the lowermost mantle (e.g., at 2850 km depth) there exists a distinct ring of fast shear-wave speeds around the Pacific, whereas underneath Africa and the Pacific one can clearly distinguish low shear-wave speed anomalies associated with large-scale upwellings (superplumes). Courtesy of Bogdan Kustowski.
+ zoom in
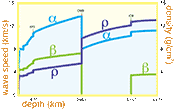
Compressional-wave speed α , shear-wave speed β , and density ρ in the spherically symmetric, isotropic Preliminary Reference Earth Model (PREM) [Dziewonski and Anderson, 1981]. (Strictly speaking, PREM is a transversely isotropic Earth model characterized by five elastic parameters.) The locations of the fuid-solid inner-core (ICB) and core-mantle (CMB) boundaries are marked. The model is capped by a 3 km thick uniform oceanic layer. There are also a number of solid-solid boundaries, including the "Moho" discontinuity between the crust and mantle at a depth of 24.4 km, and upper-mantle discontinuities at depths of 220, 400 and 670 km.
+ zoom in
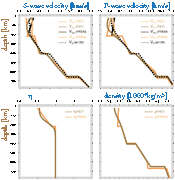
STW105 (also known as REF): A transversely isotropic reference Earth model. From Kustowski B., G. Ekström, and A. M. Dziewonski (2008), Anisotropic shear-wave velocity structure of the Earth's mantle: A global model, J. Geophys. Res., 113, B06306, doi:10.1029/2007JB005169.
Movie
Generation
Finally, after the full 3-D wave simulation, we collect the surface motion data (displacement, velocity, or acceleration), and map them on top of the topography of the globe. The data is thus rendered and bundled into movies.

+ zoom in
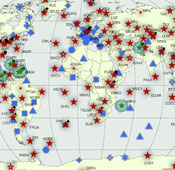
Vertical component data (black) and 3D SEM synthetic seismograms (red) for the January 26, 2001 Bhuj India event (Mw=7.6, depth of 20 km) are plotted on the globe. Stations are denoted by yellow triangles and labeled by their station codes. The instrument response was deconvolved from the data to obtain displacement seismograms and the synthetics were convolved with a Gaussian source time function. Both the data and the synthetic seismograms were subsequently band pass filtered between 40 and 500 sec with a Butterworth filter.
For more information: The Spectral-Element Method, Beowulf Computing, and Global Seismology [PDF]
Review
and
Dis-
semination
The resulting earthquake movies are then indexed into our event database, published via this portal, and then notifications are available via our RSS Feed.
The color scale of the wave motion movies changes from event to event in order to accommondate the events maximum intensity.
Notice that since intensity grows exponentially, if we used one static color scale, then either small earthquakes would not be seen, or large earthquakes would oversaturate the map.
What causes earthquakes to happen?
An earthquake is caused by a sudden slip on a fault. Stresses in the earth's outer layer push the sides of the fault together. Stress builds up and the rocks slips suddenly, releasing energy in waves that travel through the earth's crust and cause the shaking that we feel during an earthquake. An EQ occurs when plates grind and scrape against each other. In California there are two plates the Pacific Plate and the North American Plate. The Pacific Plate consists of most of the Pacific Ocean floor and the California Coast line. The North American Plate comprises most the North American Continent and parts of the Atlantic Ocean floor. These primary boundary between these two plates is the San Andreas Fault. The San Andreas Fault is more than 650 miles long and extends to depths of at least 10 miles. Many other smaller faults like the Hayward (Northern California) and the San Jacinto (Southern California) branch from and join the San Andreas Fault Zone. The Pacific Plate grinds northwestward past the North American Plate at a rate of about two inches per year. Parts of the San Andreas Fault system adapt to this movement by constant "creep" resulting in many tiny shocks and a few moderate earth tremors. In other areas where creep is NOT constant, strain can build up for hundreds of years, producing great EQs when it finally releases.
Can human activity cause earthquakes?
Earthquakes induced by human activity have been documented in a few locations in the United States, Japan, and Canada. The cause was injection of fluids into deep wells for waste disposal and secondary recovery of oil, and the use of reservoirs for water supplies. Most of these earthquakes were minor. The largest and most widely known resulted from fluid injection at the Rocky Mountain Arsenal near Denver, Colorado. In 1967, an earthquake of magnitude 5.5 followed a series of smaller earthquakes. Injection had been discontinued at the site in the previous year once the link between the fluid injection and the earlier series of earthquakes was established. (Nicholson, Craig and Wesson, R.L., 1990, Earthquake Hazard Associated with Deep Well Injection--A Report to the U.S. Environmental Protection Agency: U.S. Geological Survey Bulletin 1951, 74 p.) Other human activities, even nuclear detonations, have not been linked to earthquake activity. Energy from nuclear blasts dissipates quickly along the Earth's surface. Earthquakes are part of a global tectonic process that generally occurs well beyond the influence or control of humans. The focus (point of origin) of earthquakes is typically tens to hundreds of miles underground. The scale and force necessary to produce earthquakes are well beyond our daily lives. We cannot prevent earthquakes; however, we can significantly mitigate their effects by identifying hazards, building safer structures, and providing education on earthquake safety.
What is a fault?
 A fault is a fracture or zone of fractures between two blocks of
rock. Faults allow the blocks to move relative to each other. This
movement may occur rapidly, in the form of an earthquake - or may
occur slowly, in the form of creep. Faults may range in length from a
few millimeters to thousands of kilometers. Most faults produce
repeated displacements over geologic time. During an earthquake, the
rock on one side of the fault suddenly slips with respect to the
other. The fault surface can be horizontal or vertical or some
arbitrary angle in between. Earth scientists use the angle of the
fault with respect to the surface (known as the dip) and the
direction of slip along the fault to classify faults. Faults which
move along the direction of the dip plane are dip-slip faults and
described as either normal or reverse, depending on their motion.
Faults which move horizontally are known as strike-slip faults and
are classified as either right-lateral or left-lateral. Faults which
show both dip-slip and strike-slip motion are known as oblique-slip
faults.
A fault is a fracture or zone of fractures between two blocks of
rock. Faults allow the blocks to move relative to each other. This
movement may occur rapidly, in the form of an earthquake - or may
occur slowly, in the form of creep. Faults may range in length from a
few millimeters to thousands of kilometers. Most faults produce
repeated displacements over geologic time. During an earthquake, the
rock on one side of the fault suddenly slips with respect to the
other. The fault surface can be horizontal or vertical or some
arbitrary angle in between. Earth scientists use the angle of the
fault with respect to the surface (known as the dip) and the
direction of slip along the fault to classify faults. Faults which
move along the direction of the dip plane are dip-slip faults and
described as either normal or reverse, depending on their motion.
Faults which move horizontally are known as strike-slip faults and
are classified as either right-lateral or left-lateral. Faults which
show both dip-slip and strike-slip motion are known as oblique-slip
faults.
What is the "intensity" of an earthquake?
The effect of an earthquake on the Earth's surface is called the intensity. The intensity scale consists of a series of certain key responses such as people awakening, movement of furniture, damage to chimneys, and finally--total destruction. Although numerous intensity scales have been developed over the last several hundred years to evaluate the effects of earthquakes, the one currently used in the United States is the Modified Mercalli (MM) Intensity Scale. It was developed in 1931 by the American seismologists Harry Wood and Frank Neumann. This scale, composed of 12 increasing levels of intensity that range from imperceptible shaking to catastrophic destruction, is designated by Roman numerals. It does not have a mathematical basis; instead it is an arbitrary ranking based on observed effects.
The Modified Mercalli Intensity value assigned to a specific site after an earthquake has a more meaningful measure of severity to the nonscientist than the magnitude because intensity refers to the effects actually experienced at that place. After the occurrence of widely-felt earthquakes, the Geological Survey mails questionnaires to postmasters in the disturbed area requesting the information so that intensity values can be assigned. The results of this postal canvass and information furnished by other sources are used to assign an intensity value, and to compile isoseismal maps that show the extent of various levels of intensity within the felt area. The maximum observed intensity generally occurs near the epicenter.
The lower numbers of the intensity scale generally deal with the manner in which the earthquake is felt by people. The higher numbers of the scale are based on observed structural damage. Structural engineers usually contribute information for assigning intensity values of Vlll or above.
The following is an abbreviated description of the 12 levels of Modified Mercalli intensity:
Modified
|
Description |
| I | Not felt except by a very few under especially favorable conditions. |
| II | Felt only by a few persons at rest, especially on upper floors of buildings. Delicately suspended objects may swing. |
| III | Felt quite noticeably by persons indoors, especially on upper floors of buildings. Many people do not recognize it as an earthquake. Standing motor cars may rock slightly. Vibration similar to the passing of a truck. Duration estimated. |
| IV | Felt indoors by many, outdoors by few during the day. At night, some awakened. Dishes, windows, doors disturbed; walls make cracking sound. Sensation like heavy truck striking building. Standing motor cars rocked noticeably. |
| V | Felt by nearly everyone; many awakened. some dishes, windows broken. Unstable objects overturned. Pendulum clocks may stop. |
| VI | Felt by all, many frightened. Some heavy furniture moved; a few instances of fallen plaster. Damage slight. |
| VII | Damage negligible in buildings of good design and construction; slight to moderate in well-built ordinary structures; considerable damage in poorly built or badly designed structures; some chimneys broken. |
| VIII | Damage slight in specially designed structures; considerable damage in ordinary substantial buildings with partial collapse. Damage great in poorly built structures. Fall of chmineys, factory stacks, columns, monuments, walls. Heavy furniture overturned. |
| IX | Damage considerable in specially designed structures; well-designed frame structures thrown out of plumb. Damage great in substantial buildings, with partial collapse. Buildings shifted off foundations. |
| X | Some well-built wooden structures destroyed; most masonry and frame structures destroyed with foundations. Rail bent. |
| XI | Few, if any (masonry) structures remain standing. Bridges destroyed. Rails bent greatly. |
| XII | Damage total. Lines of sight and level are distorted. Objects thrown into the air. |
What is the "magnitude" of an earthquake?
Seismologists indicate the size of an earthquake in units of magnitude. There are many different ways that magnitude is measured from seismograms because each method only works over a limited range of magnitudes and with different types of seismometers. Some methods are based on body waves (which travel deep within the structure of the earth), some based on surface waves (which primarily travel along the uppermost layers of the earth), and some based on completely different methodologies. However, all of the methods are designed to agree well over the range of magnitudes where they are reliable.
Earthquake magnitude is a logarithmic measure of earthquake size. In simple terms, this means that at the same distance from the earthquake, the shaking will be 10 times as large during a magnitude 5 earthquake as during a magnitude 4 earthquake. The total amount of energy released by the earthquake, however, goes up by a factor of 32.
Magnitude
|
Applicable
|
Distance
|
Comments |
|
Md
Duration |
<4 |
0-400
km |
Based on the duration of shaking as measured by the time decay of the amplitude of the seismogram. Often used to compute magnitude from seismograms with "clipped" waveforms due to limited dynamic recording range of analog instrumentation, which makes it impossible to measure peak amplitudes. |
|
ML
Local |
2-6 |
0-400
km |
The original magnitude relationship defined by Richter and Gutenberg for local earthquakes in 1935. It is based on the maximum amplitude of a seismogram recorded on a Wood-Anderson torsion seismograph. Although these instruments are no longer widely in use, ML values are calculated using modern instrumentation with appropriate adjustments. |
|
Ms
Surface Wave |
5-8 |
20-180
degrees |
A magnitude for distant earthquakes based on the amplitude of Rayleigh surface waves measured at a period near 20 sec. |
|
Mw
Moment |
>3.5 | all | Based on the moment of the earthquake, which is equal to the rigidity of the earth times the average amount of slip on the fault times the amount of fault area that slipped. |
|
Mb
Body |
4-7 |
16-100
degrees (only deep earthquakes) |
Based on the amplitude of P body-waves. This scale is most appropriate for deep-focus earthquakes. |
What is the velocity, acceleration, and displacement of an earthquake?
Acceleration is the rate of change in velocity of the ground shaking (how much the velocity changes in a unit time), just as it is the rate of change in the velocity of your car when you step on the accelerator or put on the brakes. Velocity is the measurement of the speed of the ground motion. Displacement is the measurement of the actual changing location of the ground due to shaking. All three of the values can be measured continuously during an earthquake.
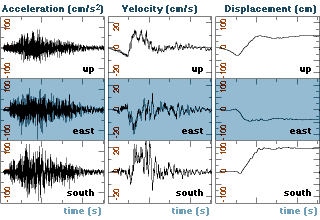
Acceleration
During an earthquake when the ground is shaking, it experiences acceleration. The peak acceleration is the largest acceleration recorded by a particular station during an earthquake.
Displacement
Displacement is the difference between the initial position of a reference point and any later position. The amount any point affected by an earthquake has moved from where it was before the earthquake.
Velocity
Velocity is simply how fast a point on the ground is shaking as a result of an earthquake.
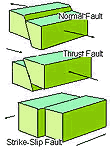
What are the "beachballs"?
 Seismologists refer to the direction of slip in an earthquake and
the orientation of the fault on which it occurs as the
focal mechanism. They use information
from seismograms to calculate the focal mechanism and typically
display it on maps as a "beach ball" symbol.
Seismologists refer to the direction of slip in an earthquake and
the orientation of the fault on which it occurs as the
focal mechanism. They use information
from seismograms to calculate the focal mechanism and typically
display it on maps as a "beach ball" symbol.
This symbol is the projection on a horizontal plane of the lower half of an imaginary, spherical shell (focal sphere) surrounding the earthquake source (A). A line is scribed where the fault plane intersects the shell. The stress-field orientation at the time of rupture governs the direction of slip on the fault plane, and the beach ball also depicts this stress orientation. In this schematic, the gray quadrants contain the tension axis (T), which reflects the minimum compressive stress direction, and the white quadrants contain the pressure axis (P), which reflects the maximum compressive stress direction. The computed focal mechanisms show only the P and T axes.
What is a CMT solution?
In our 3D spectral-element and 1D normal-mode simulations, earthquakes are represented by point sources. The parameters describing the point source may be obtained directly from the global Centroid Moment Tensor (CMT) web pages (www.globalcmt.org). A CMT solution file (CMTSOLUTION) consists of a centroid time, geographical coordinates of the epicenter, depth, and a moment tensor. The magnitude of the earthquake and its fault mechanism are captured by the moment tensor. Source location and timing are defined by the centroid location and the centroid time, respectively. The centroid time and centroid location are generally not associated with the rupture initiation point, but rather with the dominant moment release during the rupture process.
What is the origin time in the synthetic seismograms?
Zero time in the synthetic seismograms corresponds to the centroid time (CMT time) of the earthquake. Normal-mode synthetic seismogram start at time t = 0, but, for numerical reasons, spectral-element seismograms start at negative times (t < 0). Please see the SPECFEM3D_GLOBE user manual for detailed information.
What is the source half-duration?
The source half-duration describes the duration of the rupture process. In our simulations, the half-duration is set to zero, which corresponds to simulating synthetics with a step (Heaviside) source-time function, i.e., the moment-rate function is a delta function. Because of this, the synthetic seismograms may be convolved with a variety of source-time functions after the simulation using the post-processing scripts. Note therefore that we alter the CMTSOLUTION file obtained from the global CMT project (www.globalcmt.org) by setting the half-duration equal to zero.
Before comparing the synthetic seismograms to data, you must bandpass filter both the data and the synthetics with the same set of filters, convolve the synthetics with the desired source half-duration, and deconvolve the instrument response from the data. The 3D SEM synthetics are accurate at periods between ~17 s and 500 s, whereas the 1D mode synthetics are accurate at periods of ~8 s and longer.
What is the format of the seismograms?
The synthetic seismograms are in SAC (Seismic Analysis Code) binary format. Most information about the simulation (i.e., event/station information, sampling rate, etc.) is provided in the SAC headers of each seismogram. A list of SAC header entries and their explanation for sample SEM and modes seismograms is shown in the table SAC Headers. For more detailed information see the SAC webpages (iris.edu/software/sac/).
How to compare observed and synthetic seismograms?
Since the synthetic seismograms are accurate for a certain frequency range, both observed and synthetic seismograms must be processed before a comparison can be made. For such comparisons, the following steps are recommended:
- Make sure that both synthetic and observed seismograms have the correct station/event and timing information.
- Convolve synthetic seismograms with a source time function with the desired half-duration specified in a CMTSOLUTION file.
- Resample both observed and synthetic seismograms to a common sampling rate.
- Cut the observed and synthetic records using the same window.
- Remove the trend and mean from the the observed and synthetic records and taper them.
- Remove the instrument response from the observed seismograms (recommended) or convolve the synthetic seismograms with the instrument response.
- Make sure that you apply the exact same filtering operations to both observed and synthetic seismograms. Preferably, avoid filtering your records more than once, and if you do filter more than once, make sure you filter both the data and the synthetics with the same filter, such that data and synthetics are always subjected to the same filtering operations.
- Now you are ready to compare your synthetic and observed seismograms.
What is the naming convention of synthetic seismograms?
The following format is used to name synthetic seismograms:
STA.NT.CHN.MT.sac
where STA and NT are the station and
network codes given in the STATIONS file,
CHN is the
channel code
of synthetics, MT represent the method used
to compute synthetic seismograms
(sem and modes for spectral-element and
normal-mode seismograms, respectively)
and sac denotes the format of seismograms,
which is SAC binary.
Example:
For station AAK of network IU,
vertical-component spectral-element
and normal-mode seismograms are named
AAK.IU.MXZ.sem.sac and
AAK.IU.LXZ.modes.sac, respectively.
What is the convention used for the channel codes of synthetic seismograms?
Seismic networks, such as the Global Seismographic Network (GSN), generally involve various types of instruments with different bandwidths, sampling properties and component configurations. There are standards to name channel codes depending on instrument properties. IRIS (www.iris.edu) uses SEED/FDSN format for channel codes, which are represented by three letters, such as LHN, BHZ, etc. To avoid confusion when comparisons are made with observed data, the FDSN convention is also used for spectral-element and normal-mode seismograms. A brief explanation of the FDSN convention and how it is adopted in spectral-element and normal-mode seismograms may be found in the following. Please visit www.iris.edu/manuals/SEED_appA.htm for further information.
Band code:
The first letter in channel codes denotes the band code
of seismograms, which depends on the response
band and the sampling rate of instruments. The list of
band codes used by IRIS is shown in the table below. The sampling rate
of spectral-element synthetics is controlled by the
resolution of simulations rather than instrument properties.
However, for consistency, we follow the FDSN convention for
spectral-element and normal-mode seismograms governed
by their sampling rate. For spectral-element synthetics,
we consider band codes for which dt ≤ 1 s.
The sampling rate of normal-mode synthetics is fixed to
dt = 2 s.
According to this, given the current resolution of the synthetics
provided by the Global ShakeMovie Portal, band codes of
spectral-element and normal-mode seismograms are M and
L, respectively. For simulations with higher resolution
reference models, band codes of spectral-element seismograms
may change in future, depending on the sampling rate.
The FDSN convention also considers the response band of instruments.
For instance, short-period and broad-band
seismograms with the same sampling rate correspond to different
band codes, such as S and B, respectively. In such
cases, spectral-element seismograms will be considered as broad band,
ignoring the corner period (≥ 10 s) of the
response band of instruments (note that at this resolution,
the minimum period in spectral-element synthetics will be
less than 10 s). Accordingly, the band code will be chosen
depending on the resolution of the synthetics, and channel
codes of spectral-element seismograms will start with either
L, M, B, H, C or F,
as shown by red color in the table.
Instrument code:
The second letter in channel codes corresponds to instrument codes,
which specify the family to which the sensor belongs.
For instance, H and L are used for
high-gain and low-gain seismometers, respectively.
The instrument code of spectral-element and normal-mode
seismograms will always be X, as assigned by FDSN for
synthetic seismograms.
Orientation code:
The third letter in channel codes is an orientation code,
which generally describes the physical
configuration of the components of instrument packages.
For spectral-element and normal-mode seismograms the
traditional orientation codes E/N/Z
(East-West, North-South, Vertical) for three components are used.
EXAMPLE:
Depending on the resolution of spectral-element simulations,
if the sampling rate is greater than 0.1 s and
less than 1 s, a seismogram recorded on the vertical
component of station AAK will be named AAK.IU.MXZ.sem.sac,
whereas it will be AAK.IU.BXZ.sem.sac, if the sampling rate
is greater than 0.0125 and less equal to 0.1 s.
For normal-mode synthetics, it will be AAK.IU.LXZ.modes.sac,
since a fixed sampling rate is used (dt = 2 s) for
normal-mode seismograms.
Band
|
Band type |
Sampling rate (sec) |
Corner
|
| F | --- | > 0.0002 to <= 0.001 | ≥ 10 sec |
| G | --- | > 0.0002 to <= 0.001 | < 10 sec |
| D | --- | > 0.001 to <= 0.004 | < 10 sec |
| C | --- | > 0.001 to <= 0.004 | ≥ 10 sec |
| E | Extremely Short Period | <= 0.0125 | < 10 sec |
| S | Short Period | <= 0.1 to > 0.0125 | < 10 sec |
| H | High Broad Band | <= 0.0125 | ≥ 10 sec |
| B | Broad Band | <= 0.1 to > 0.0125 | ≥ 10 sec |
| M | Mid period | < 1 to > 0.1 | |
| L | Long Period | 1 | |
| V | Very Long Period | 10 | |
| U | Ultra Long Period | 100 | |
| R | Extremely Long Period | 1000 | |
| P | On the order of 0.1 to 1 day | <=100000 to > 10000 | |
| T | On the order of 1 to 10 days | <=1000000 to > 100000 | |
| Q | Greater than 10 days | > 1000000 | |
| A | Administrative Instrument Channel | variable | NA |
| O | Opaque Instrument Channel | variable | NA |
The FDSN band code convention is based on sampling rate and instrument response band. Please visit www.iris.edu/manuals/SEED_appA.htm for further information. Grey rows show the relative band-code range for synthetic seismograms, and the band codes used to name spectral-element seismograms are denoted in red.
Which coordinates are used in simulations?
Source and receiver locations in the CMTSOLUTION and STATIONS files are expressed in geographic coordinates.
Which stations are used for simulations?
The current STATIONS file generally covers the permanent broadband FDSN stations. New entries are added to the list as new permanent stations become available.